Imagine three investors each putting $1,000 into a different altcoin at the start of the year. One is sitting on solid gains, one is deep in the red, and one is quietly outperforming the broader market. That is the real story behind XRP vs Solana vs TRON profit performance so far this year, and the gap between them is bigger than most headlines suggest.
Large-cap altcoins can move in completely different directions even under the same market conditions — averages hide the real spread between winners and losers.
Why Altcoin Profit Comparisons Need Real Numbers
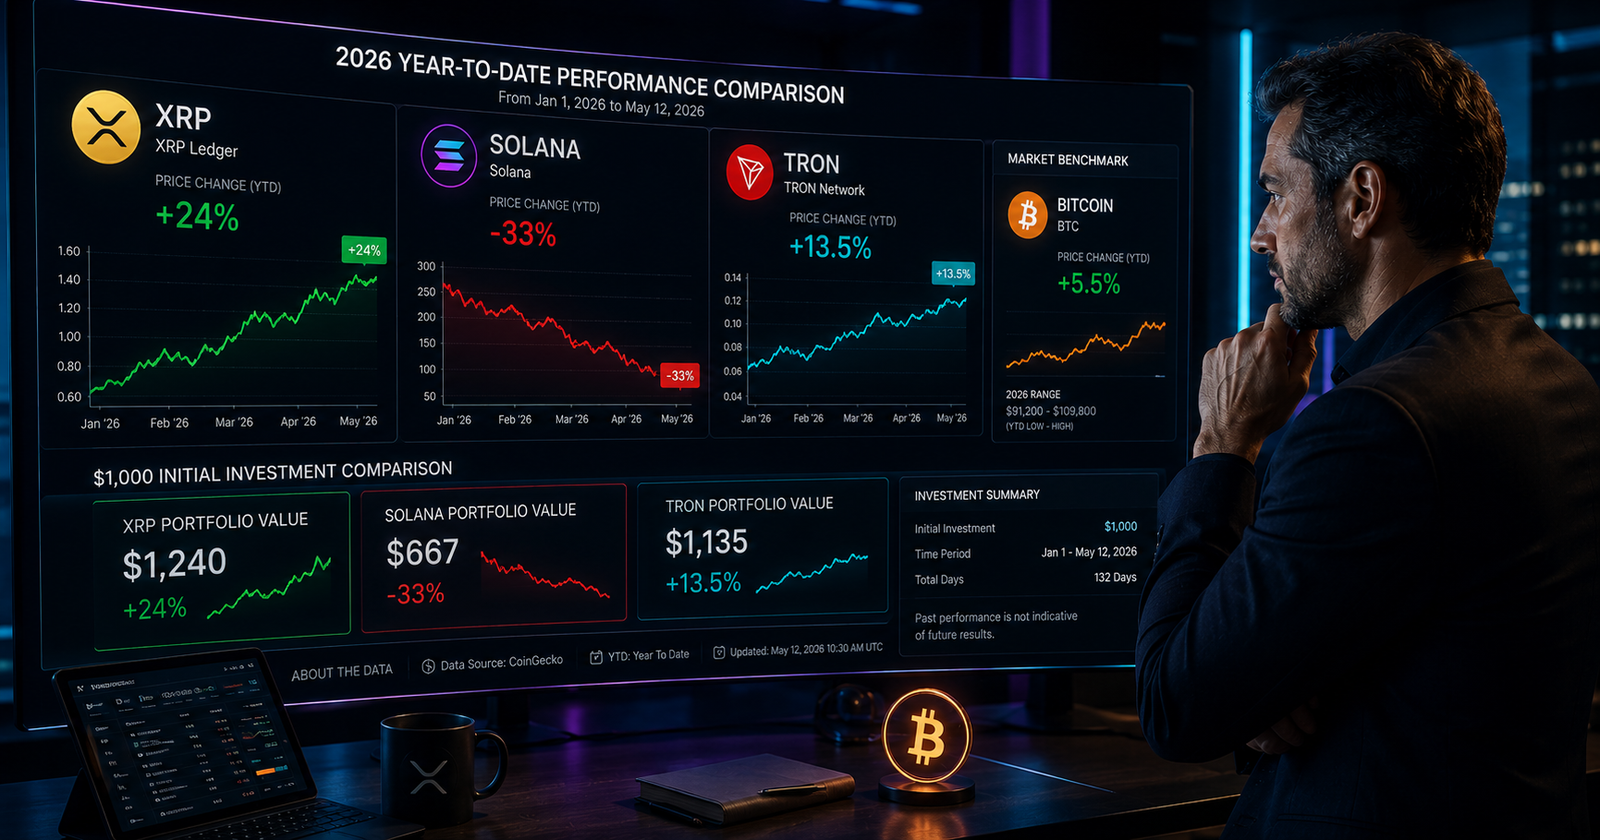
A fair crypto profit comparison has to use actual price data, not predictions. Year-to-date, XRP has appreciated by roughly 24%, notably outperforming Bitcoin’s 5.5% gain over the same stretch, based on CoinMarketCap price data. SOL, meanwhile, has struggled, falling around 33% in the first quarter alone as broader risk appetite for smart-contract platforms cooled. TRX has quietly held up better than most of the broader market during the same period, positioning it as an unexpected relative outperformer among large-cap altcoins.
XRP: +24% YTD • Solana: -33% in Q1 • TRON: +13.5% YTD — three very different outcomes in the same market.
How to Track Realized vs Unrealized Profit Across Coins
Comparing coins fairly means separating what you have actually locked in from what still exists only on paper — a distinction that matters even more when the coins in question are moving in opposite directions.
Realized Profit
This is the gain or loss you lock in the moment you sell, based on your actual entry and exit price.
Unrealized Profit
This is your paper gain or loss on coins you still hold, and it changes every time the price moves.
A Real Example of Altcoin Performance Comparison
Picture $1,000 invested in each coin at the same starting point. Historically, based on the price moves above, the XRP position would sit near $1,240, the SOL position near $667, and the TRX position near $1,135, since TRON has climbed roughly 13.5% even while the total crypto market cap pulled back about 22% over the same window, according to CoinGecko market data. This kind of altcoin performance comparison shows why blended portfolios often outperform any single coin bet.
| Coin | $1,000 Starting Position | Year-to-Date Change |
|---|---|---|
| XRP | $1,240 | +24.0% |
| Solana | $667 | -33.3% |
| TRON | $1,135 | +13.5% |
Illustrative example based on reported year-to-date price moves — not a projection of future returns.
Comparing a fixed dollar amount across coins makes the profit gap easy to see — plug in your own entry price to check where your actual position stands.
Altcoin prices are highly volatile, and past performance never guarantees future results. Any of these positions could reverse direction quickly.
Conclusion: Compare Your Own Numbers, Not Just Headlines
XRP vs Solana vs TRON profit performance shows how differently large-cap altcoins can move even in the same market conditions. Past performance never guarantees what happens next, so track your own entry price instead of relying on averages.
Comments
No comments yet. Be the first to share your thoughts.
Leave a comment