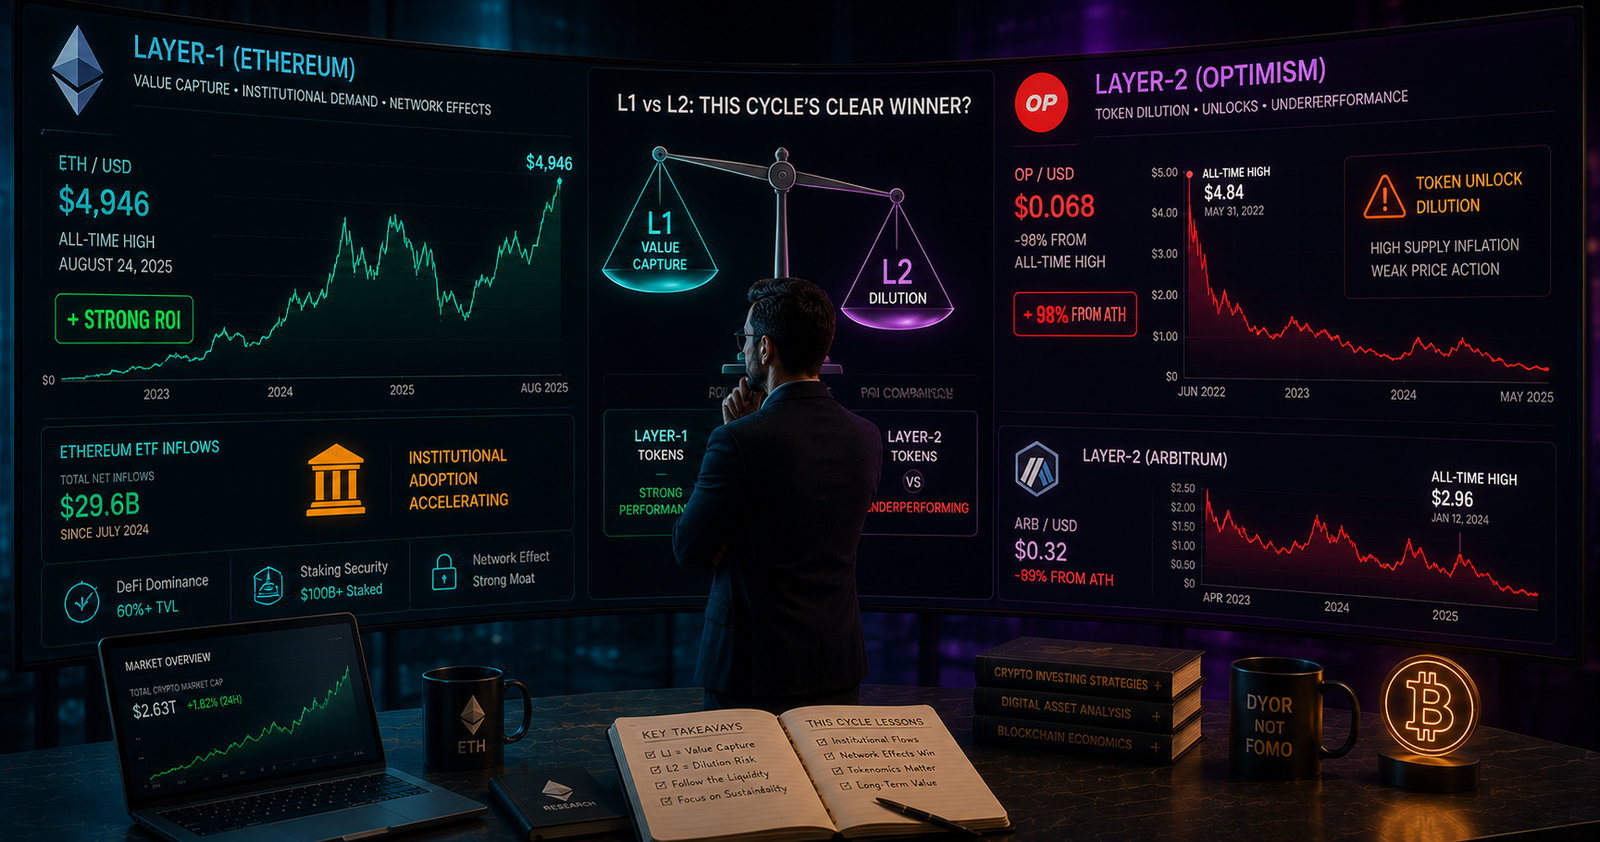
If you bought both an L1 coin and an L2 token at the start of this cycle, your portfolio probably tells two very different stories. Layer-1 vs. layer-2 tokens ROI has been one of the biggest surprises of this market: the “boring” base-layer coins often won, while flashy scaling tokens lagged behind. Here’s what actually happened, and why.
How Layer-1 Coins Performed This Cycle
Layer-1 blockchains — think ETH, SOL, BTC — settle transactions directly and secure the network themselves. Ethereum reached an all-time high near $4,946 in August 2025, according to CoinGecko’s Ethereum price data. That rally was driven largely by ETF inflows and growing corporate treasury demand, giving long-term L1 holders a strong run of historical returns, even though prices have pulled back since that peak.
Ethereum’s all-time high of roughly $4,946 was reached in August 2025 — a level tracked in real time on CoinGecko’s Ethereum price page.
How Layer-2 Tokens Performed Instead
Layer-2 tokens like ARB and OP run on top of an L1 to make transactions cheaper and faster. Despite that growing usage, most L2 tokens told a different ROI story this cycle. Optimism’s OP token reached an all-time high of $4.84 and now trades more than 98% below that peak, per CoinGecko’s Optimism price tracker. Heavy scheduled token unlocks diluted supply faster than demand could absorb it.
Realized vs. Unrealized ROI
- Realized ROI: what you’d have actually locked in by selling near a peak — L1 holders who sold ETH near its 2025 high captured real gains.
- Unrealized ROI: the paper value of tokens still held — many L2 holders are sitting on unrealized losses if they bought after 2024 highs.
| Token | All-Time High | Current Standing |
|---|---|---|
| ETH | ~$4,946 (Aug 2025) | Pulled back from peak, still historically strong |
| OP | $4.84 (Mar 2024) | ~98% below peak |
Why the ROI Gap Happened
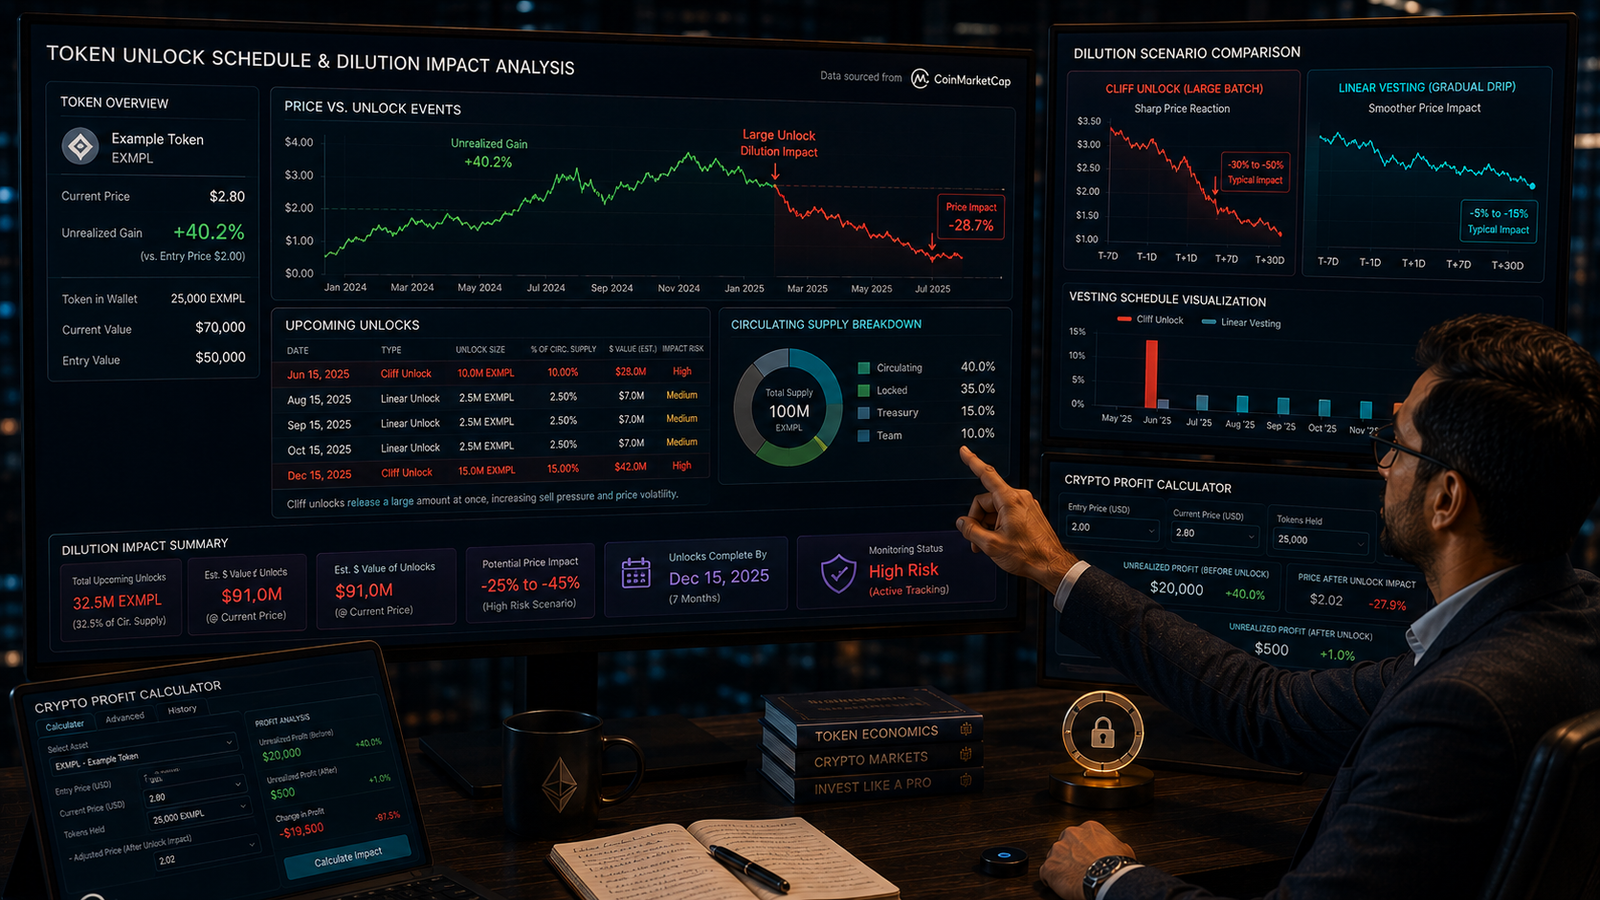
The core issue is value capture, not usage. L2 networks process real transaction volume, but many of their tokens don’t directly capture that activity through fees or buybacks. Combine that with large monthly token unlocks, and per-token value gets diluted even as the underlying network grows. This is the practical answer to did layer-2 tokens outperform layer-1 this cycle — for most major L2s, they didn’t, despite the hype around scaling adoption.
Scheduled token unlocks are public information but easy to overlook. A network can grow in usage while its token still loses value if new supply keeps outpacing demand.
Headline “cycle performance” figures average out timing that matters. Your actual ROI depends entirely on your own entry and exit prices — not the token’s broader chart.
Which Gave Better ROI, and What It Means for You
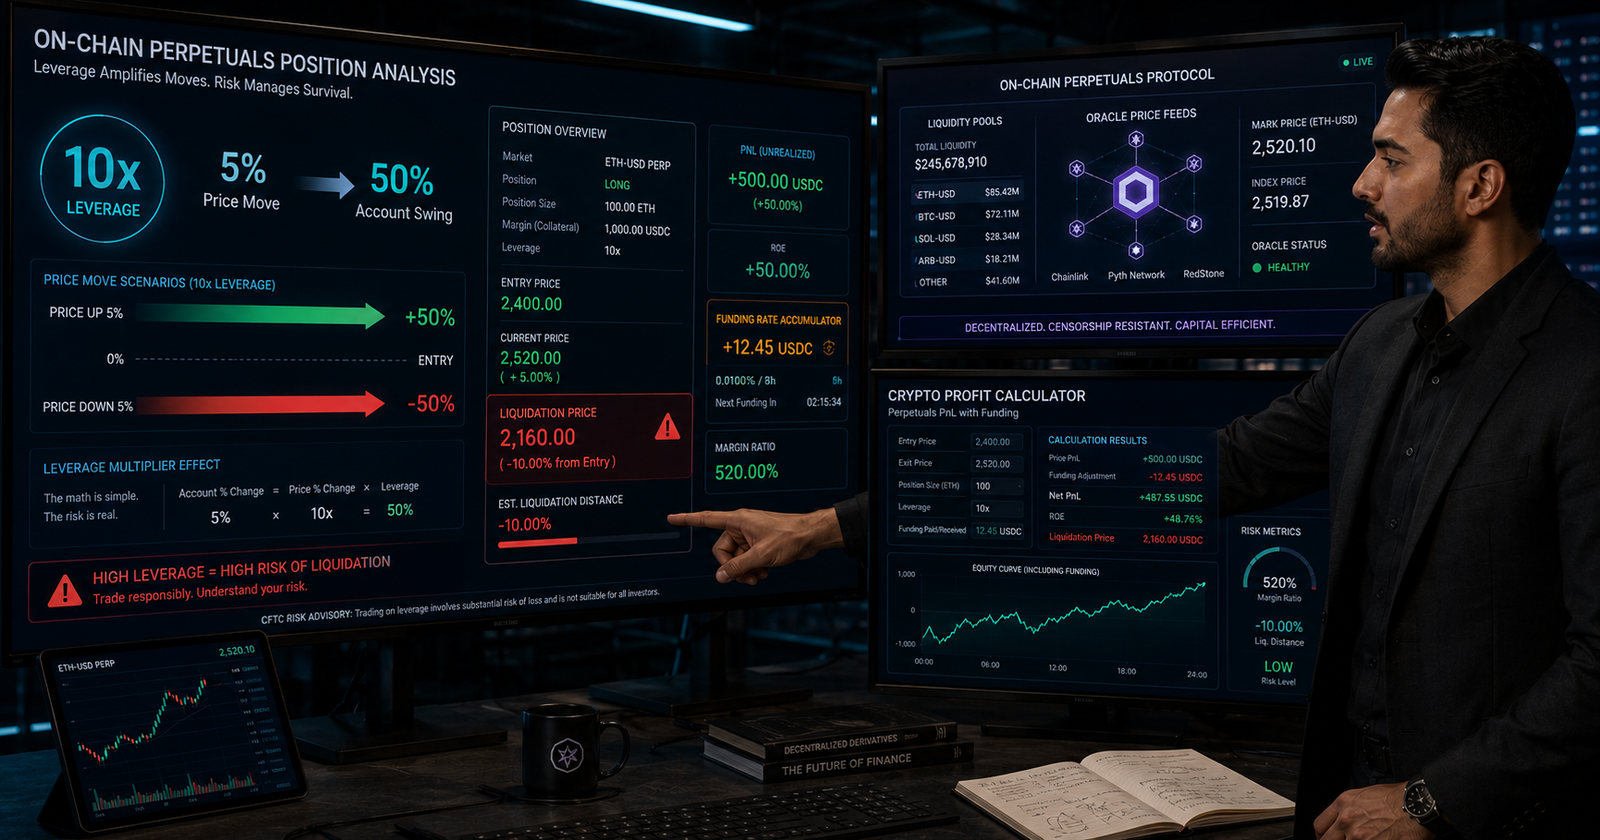
Comparing entry price to current price across your own trades is the only way to know your actual return, since headline “cycle performance” numbers can hide entry and exit timing. Use our free [Crypto Profit Calculator](https://cryptoprofitcalculator.tools/) to calculate your exact ROI on any L1 or L2 trade — no login needed.
Conclusion
When comparing layer-1 vs. layer-2 tokens ROI this cycle, established L1 networks generally delivered stronger historical returns, while many L2 tokens underperformed despite real usage growth, largely due to token unlock schedules and weak value capture. Past performance never guarantees future results, so check your own numbers before drawing conclusions.
Comments
No comments yet. Be the first to share your thoughts.
Leave a comment