Altcoin Season Index at 46: How to Check If You’re in “Bitcoin Season” Losses
If your altcoin bag looks red while Bitcoin holds steady, the Altcoin Season Index may explain why. Here’s how to tell whether your losses are a Bitcoin-led market or something specific to your picks.
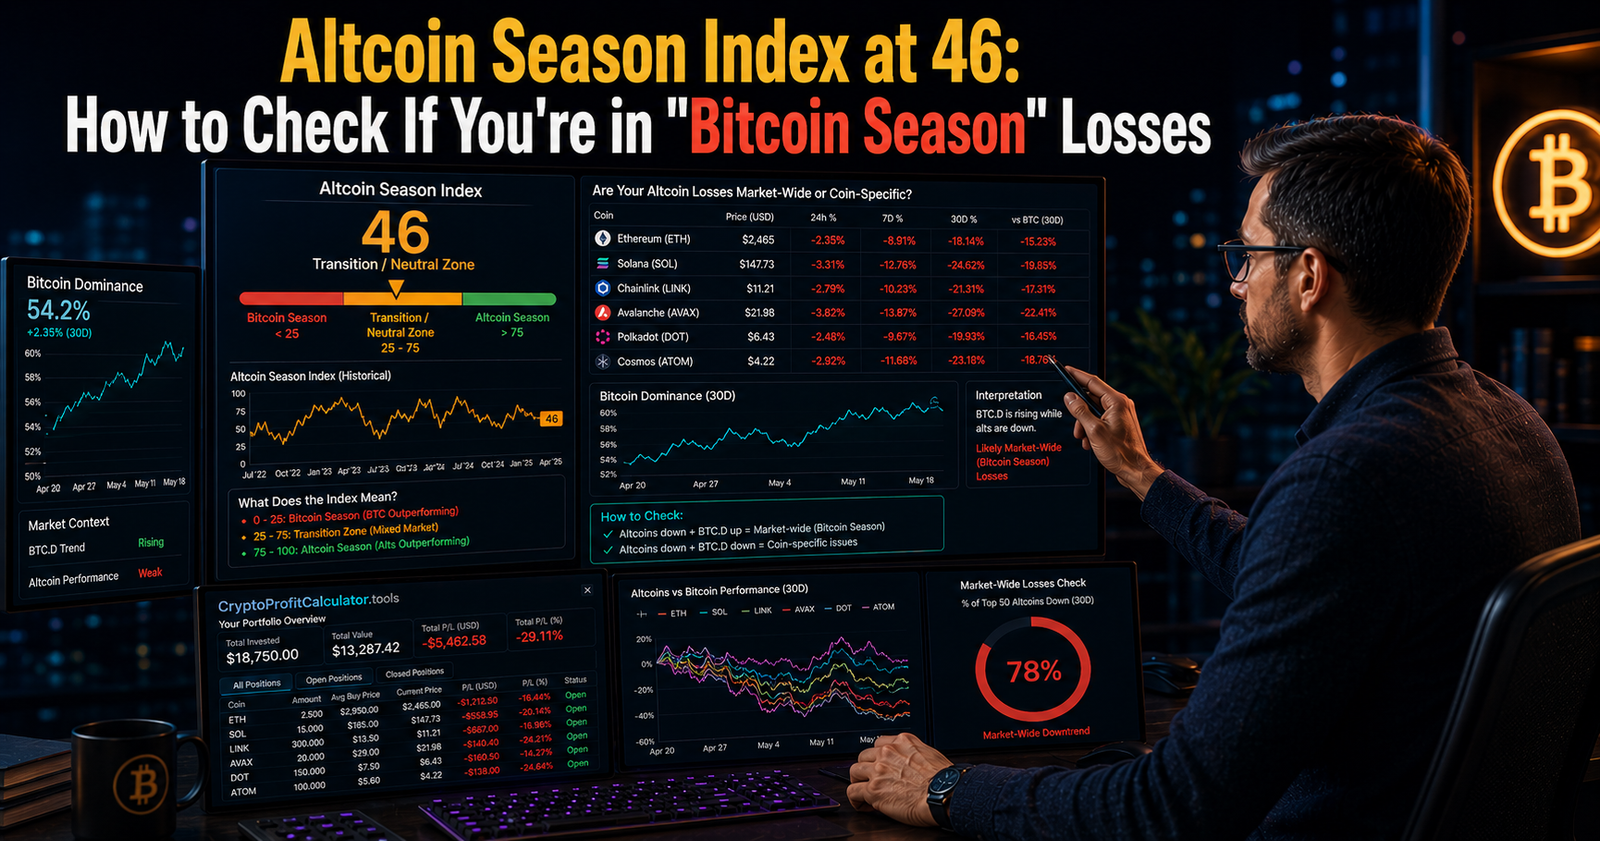
If your altcoin bag looks red while Bitcoin holds steady, the Altcoin Season Index may explain why. With the index sitting around 46 — a mixed, transitional reading — many traders are asking whether their losses reflect bad picks or simply a market where Bitcoin is leading. Here’s how to tell the difference.
What the Altcoin Season Index Actually Measures
The Altcoin Season Index tracks what percentage of the top altcoins have
outperformed BTC over the trailing 90 days. A reading above 75
signals altcoin season, while a reading below 25 signals Bitcoin season,
according to
CoinMarketCap.
A score of 46 sits in the middle zone — neither clearly favoring Bitcoin nor
altcoins, meaning capital rotation is uneven rather than broad-based.
A reading of 46 on the Altcoin Season Index sits in the mixed zone between Bitcoin Season (below 25) and Altcoin Season (above 75).
How to Check If Your Losses Are Market-Wide or Coin-Specific
Before assuming a coin is fundamentally broken, compare its performance against Bitcoin over the same period you held it. If most of your altcoins are down against USD but also down against BTC, that points to a Bitcoin-led market rather than a problem with your specific picks.
Realized vs Unrealized Losses
An unrealized loss only exists on paper until you sell. A realized loss is locked in the moment you exit the position. Knowing which one you’re looking at matters before deciding whether to hold, average down, or cut a position.
Should You Wait Out Bitcoin Season or Cut Losses?
There’s no single right answer, but running the actual numbers removes the guesswork. Comparing your entry price, current price, and percentage change against Bitcoin’s dominance trend during the same window gives a clearer picture than gut feeling alone.
| Signal | What It Suggests |
|---|---|
| Down vs USD, down vs BTC | Broad Bitcoin Season pressure, not isolated to your pick |
| Down vs USD, flat/up vs BTC | Market-wide weakness, coin holding relative strength |
| Down vs USD and BTC, wide margin | Possible coin-specific weakness worth reviewing |
Comparing your loss in USD terms against your loss in BTC terms tells you whether the market or the coin itself is the bigger factor behind the drawdown.
Use our free Crypto Profit Calculator to see your exact percentage gain or loss on any trade — no login needed.
Conclusion
The Altcoin Season Index at 46 explains part of the picture, but it does not replace checking your own numbers. Knowing whether a loss is tied to a Bitcoin-led market or a coin-specific issue helps you make a clearer decision instead of reacting to red on a screen. Run your trades through the Crypto Profit Calculator to know your numbers before deciding what to do next.