Bull Run or Consolidation? How to Track Your Portfolio’s Performance Either Way
Your portfolio can look completely different depending on whether the market is climbing or moving sideways. Here’s how to track your crypto portfolio performance in both conditions.
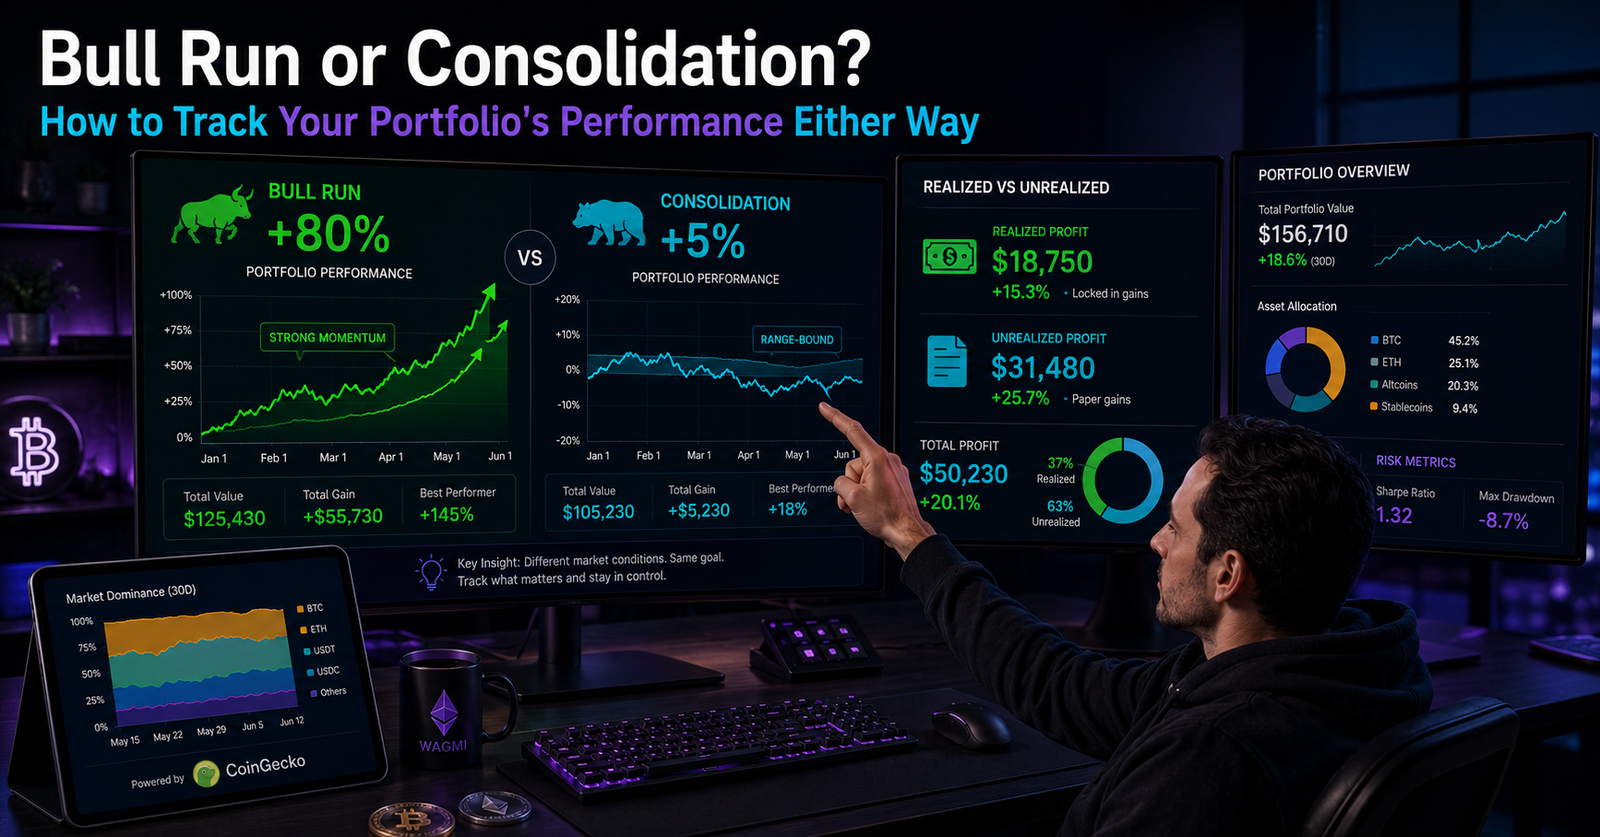
Your portfolio can look completely different depending on whether the market is climbing or moving sideways. Knowing how to track your crypto portfolio performance in both conditions keeps you grounded, whether prices are surging or stuck in a range for months.
Bull Run vs. Consolidation: What Portfolio Performance Tracking Signals Show You
A bull run usually shows rising prices across most of your holdings at once, with green numbers piling up fast. Consolidation looks different: prices trade sideways, and your portfolio value barely moves week to week.
Bitcoin dominance, calculated by dividing Bitcoin’s market capitalization by the total crypto market cap, is one useful signal here — CoinGecko’s dominance chart shows shifting capital flows that often line up with bull run and consolidation phases.
Realized vs. Unrealized Profit: The Core of Portfolio Performance Tracking
Understanding your numbers starts with one key distinction.
Unrealized Gains
This is profit on paper. If your coin’s value rose but you have not sold, that gain can disappear if the price drops again.
Realized Profit
This is profit you have actually locked in by selling. It is the only number that reflects money you can spend or reinvest.
Tracking realized and unrealized profit separately, rather than lumping them together, gives you a far more honest read on how your portfolio is really performing.
How to Track Crypto Portfolio Performance During a Sideways Market
During consolidation, percentage-based tracking matters more than dollar figures. A $500 gain means something different on a $2,000 portfolio than on a $20,000 one. Here’s a simple example:
| Scenario | Buy Price | Current Price | % Change |
|---|---|---|---|
| Coin A (bull run) | $1,000 | $1,800 | +80% |
| Coin B (consolidation) | $1,000 | $1,050 | +5% |
Both are gains, but they call for different strategies — the first might justify partial profit-taking, while the second may just mean holding steady. Reviewing your percentage gain or loss weekly, rather than reacting to daily price swings, helps you avoid emotional decisions during flat stretches.
Conclusion
Whether the market is in a bull run or stuck in consolidation, the way to track your crypto portfolio performance stays the same: separate realized from unrealized profit, and focus on percentage change over raw dollar swings.